
Climate Change -
Summary For Business Leaders
Why carbon management is important
Impacts on Society
New Zealand is projected to get hotter nation-wide and dryer east of the main divide and in the far north
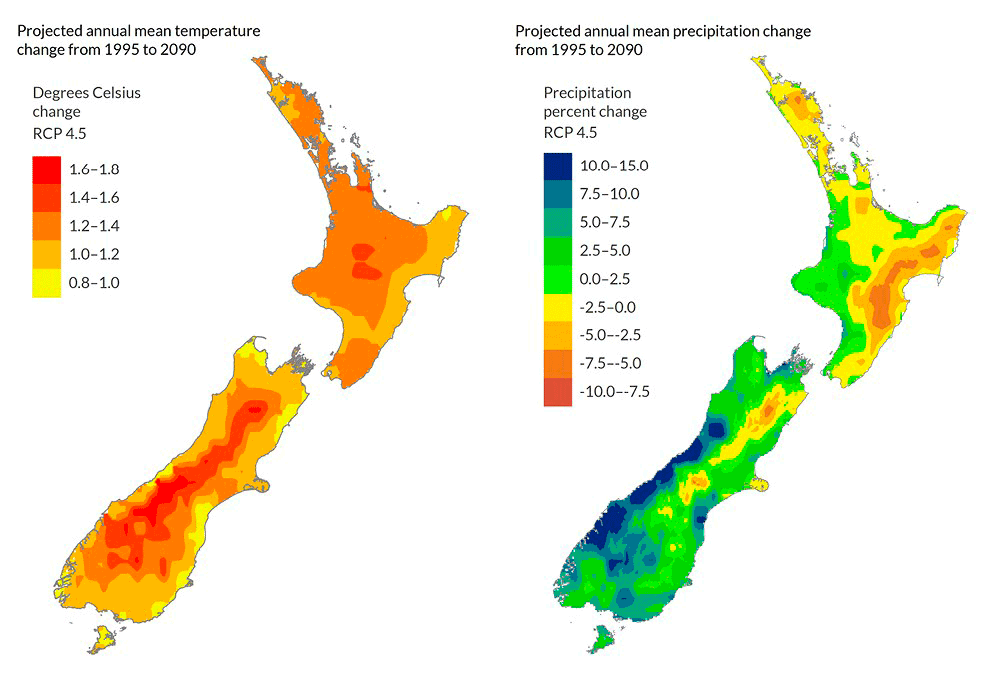
NZ Government climate projections by NIWA indicate a solid warming trend nation wide, and reduced rainfall east of the main divide and in the far north.
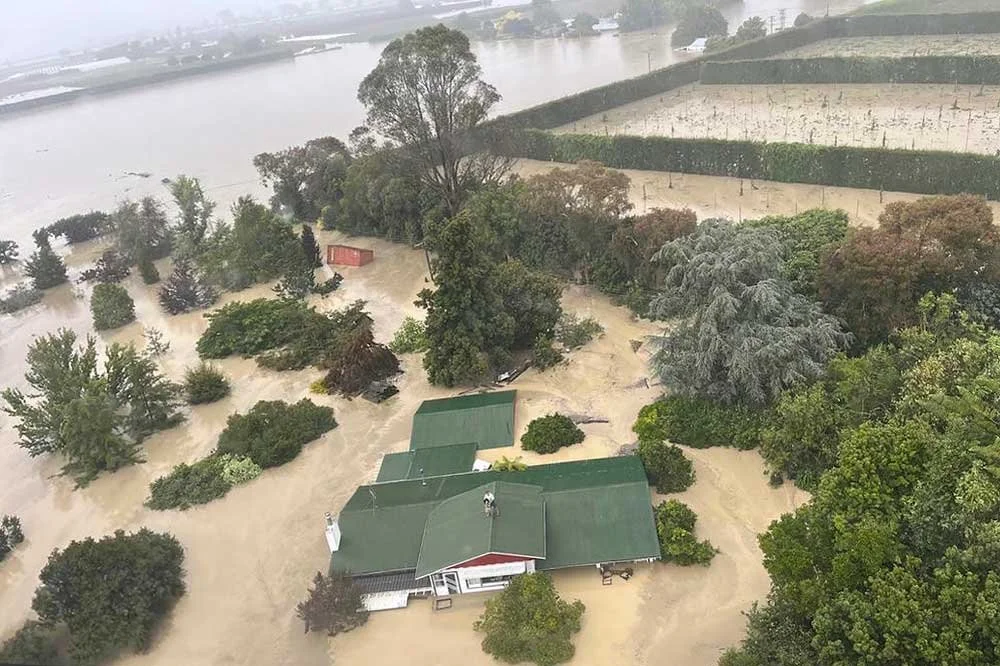
Flooding will intensify
In a warmer climate we have more water vapour in the air because of more evaporation off the oceans. This gives additional energy to storm systems that hit harder, do more damage, and cost more.

Droughts will get longer and hotter
A warming climate is a drying climate for many parts of the world including much of our farmlands. Our hill farmers are already suffering from low commodity prices, and the prospect of more intense droughts will hurt them even more.
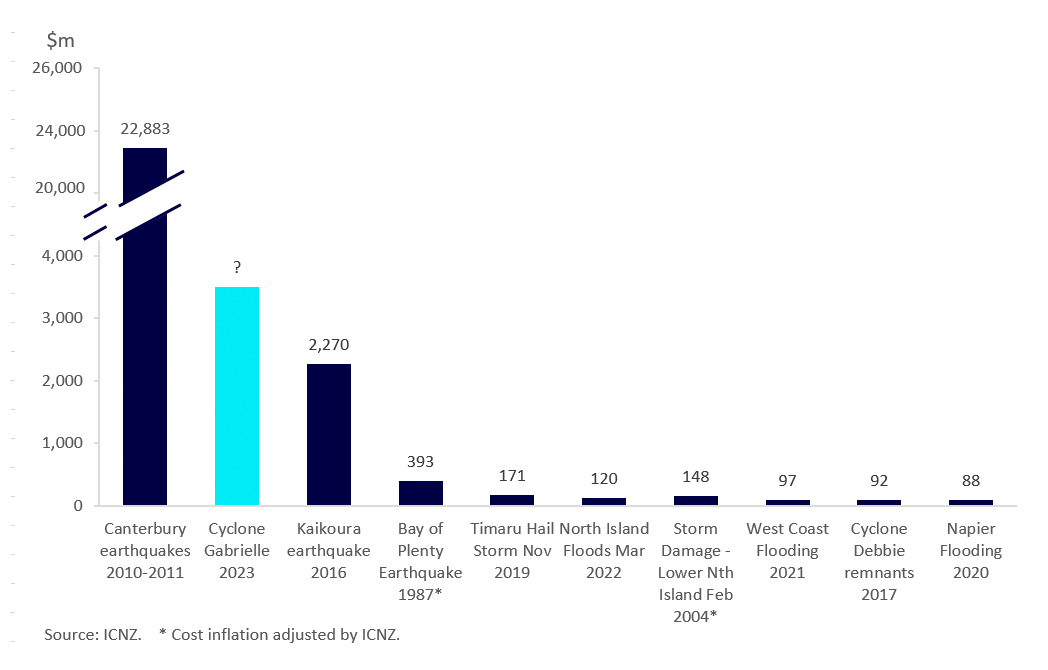
The cost of carbon pollution can be measured in the damage done by extreme weather events.
Cyclone Gabriel in 2023 cost around $4 billion and also added to inflation around the country.
The societal cost of ex-tropical cyclones is escalating
Scientific Basis
Human influence has warmed the climate at a rate that is unprecedented in at least the last 2,000 years.
Intergovernmental Panel on Climate Change (2021)
Observed changes in global surface temperature relative to 1850-1900
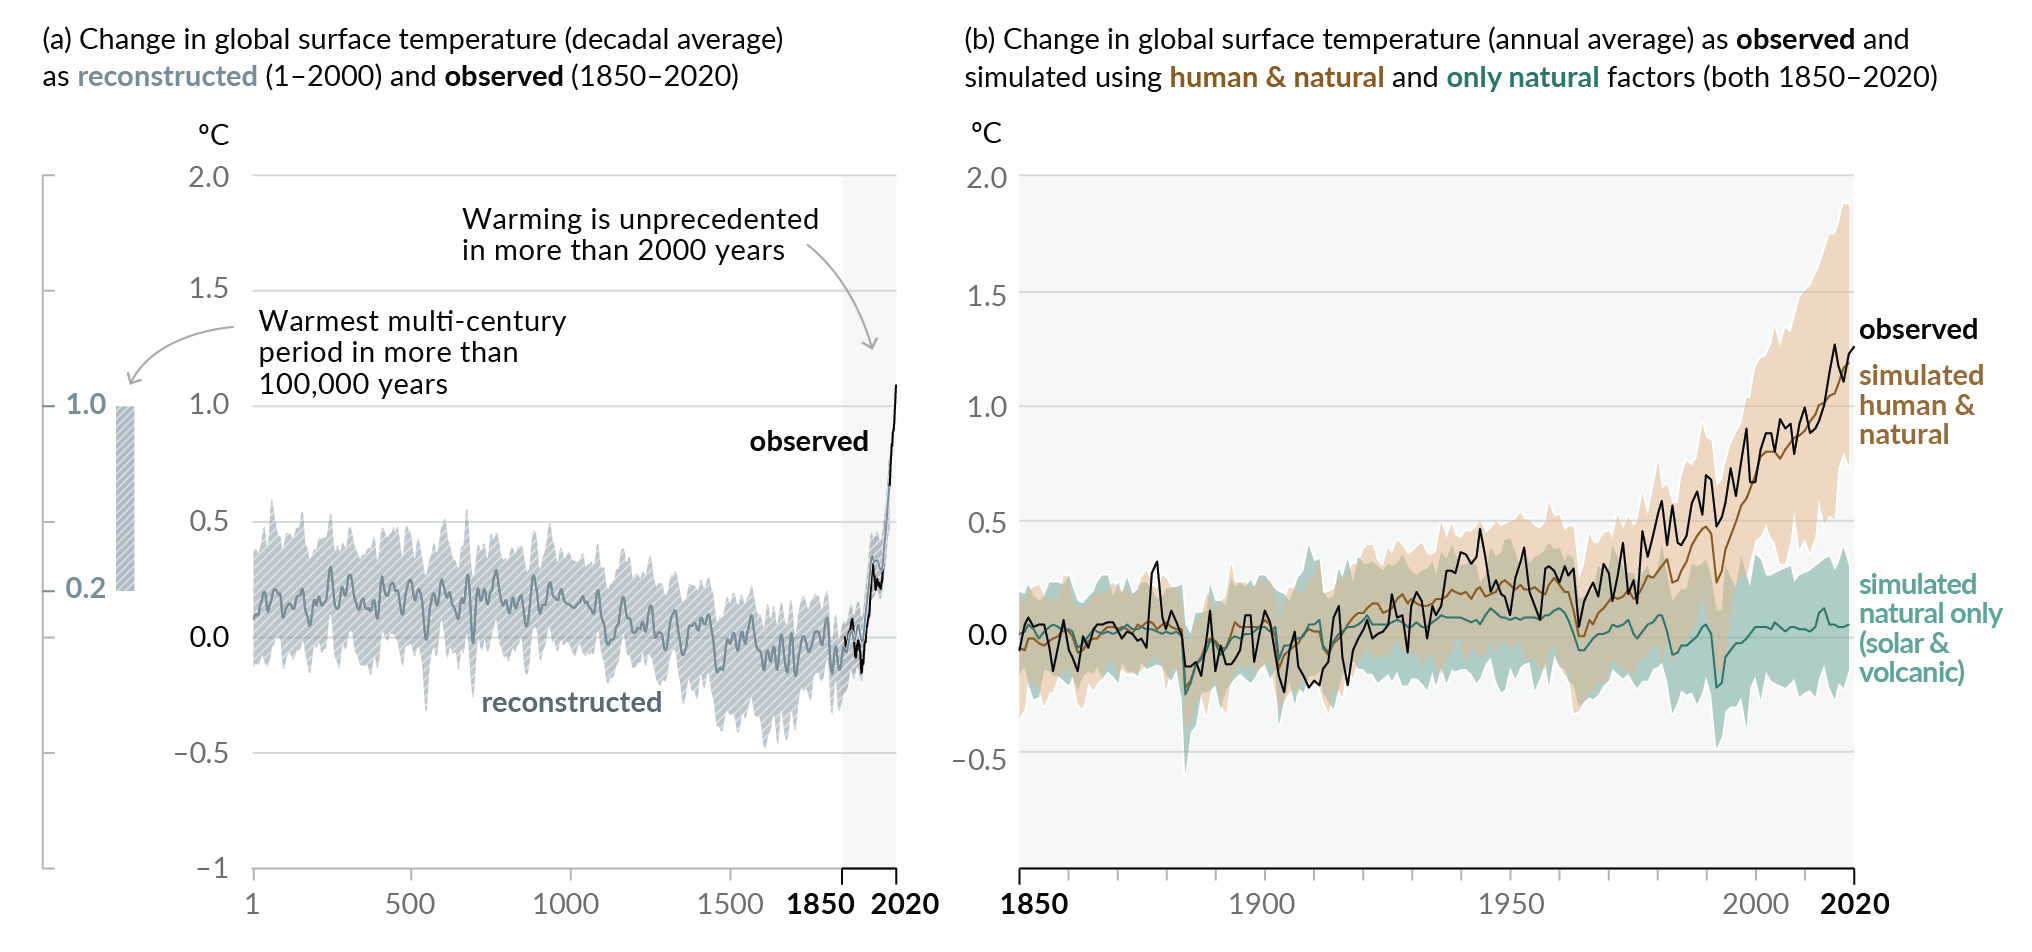
Source: IPCC AR6 WG1 Report 2021
Rising temperatures will shift rainfall distribution, change seasonality, increase storm intensities, increase drought intensities, melt glaciers and polar ice caps raising sea levels.
Global surface temperature is rising and project to rise further
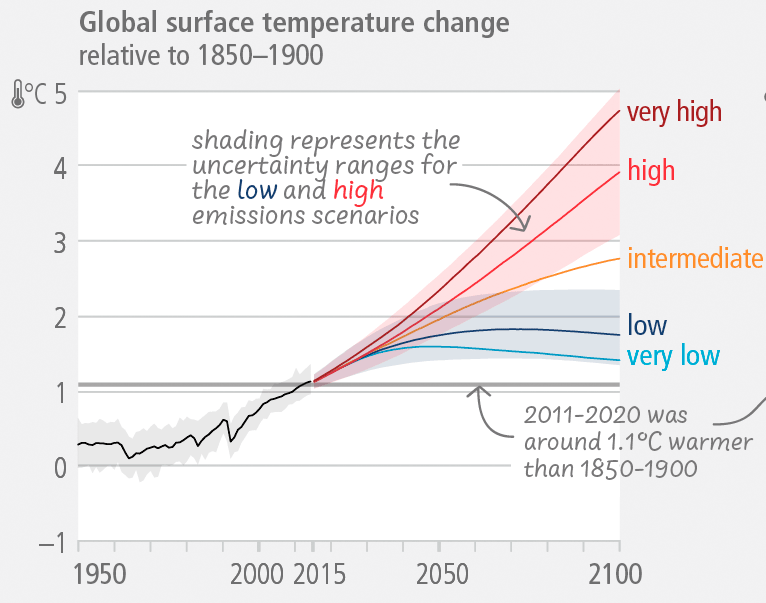
Source: IPCC AR6 Synthesis Report 2023
Projections in global sea level
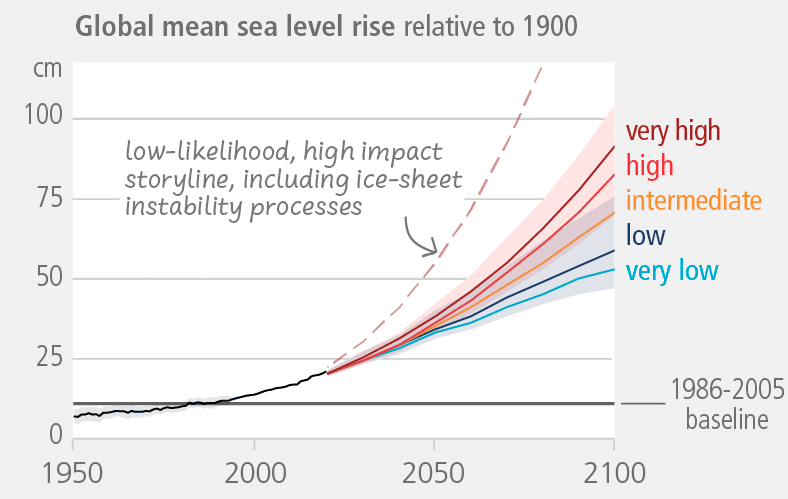
SourceL IPCC AR6 Synthesis Report 2023
Rising sea levels will threaten coastal property and infrastructure, erode coastlines, and cause flooding in the lower reaches of river catchments. This will be exacerbated by storm surges that raises sea levels due to the low atmospheric pressure in storm systems.
Adverse impacts from human-caused climate change will continue to intensify
Among the biggest negative impacts of global heating is the increase in the intensity of droughts. This will make it more difficult to feed the 8 billion people now in the world - a population that is rising by around 80 million annually (births minus deaths).
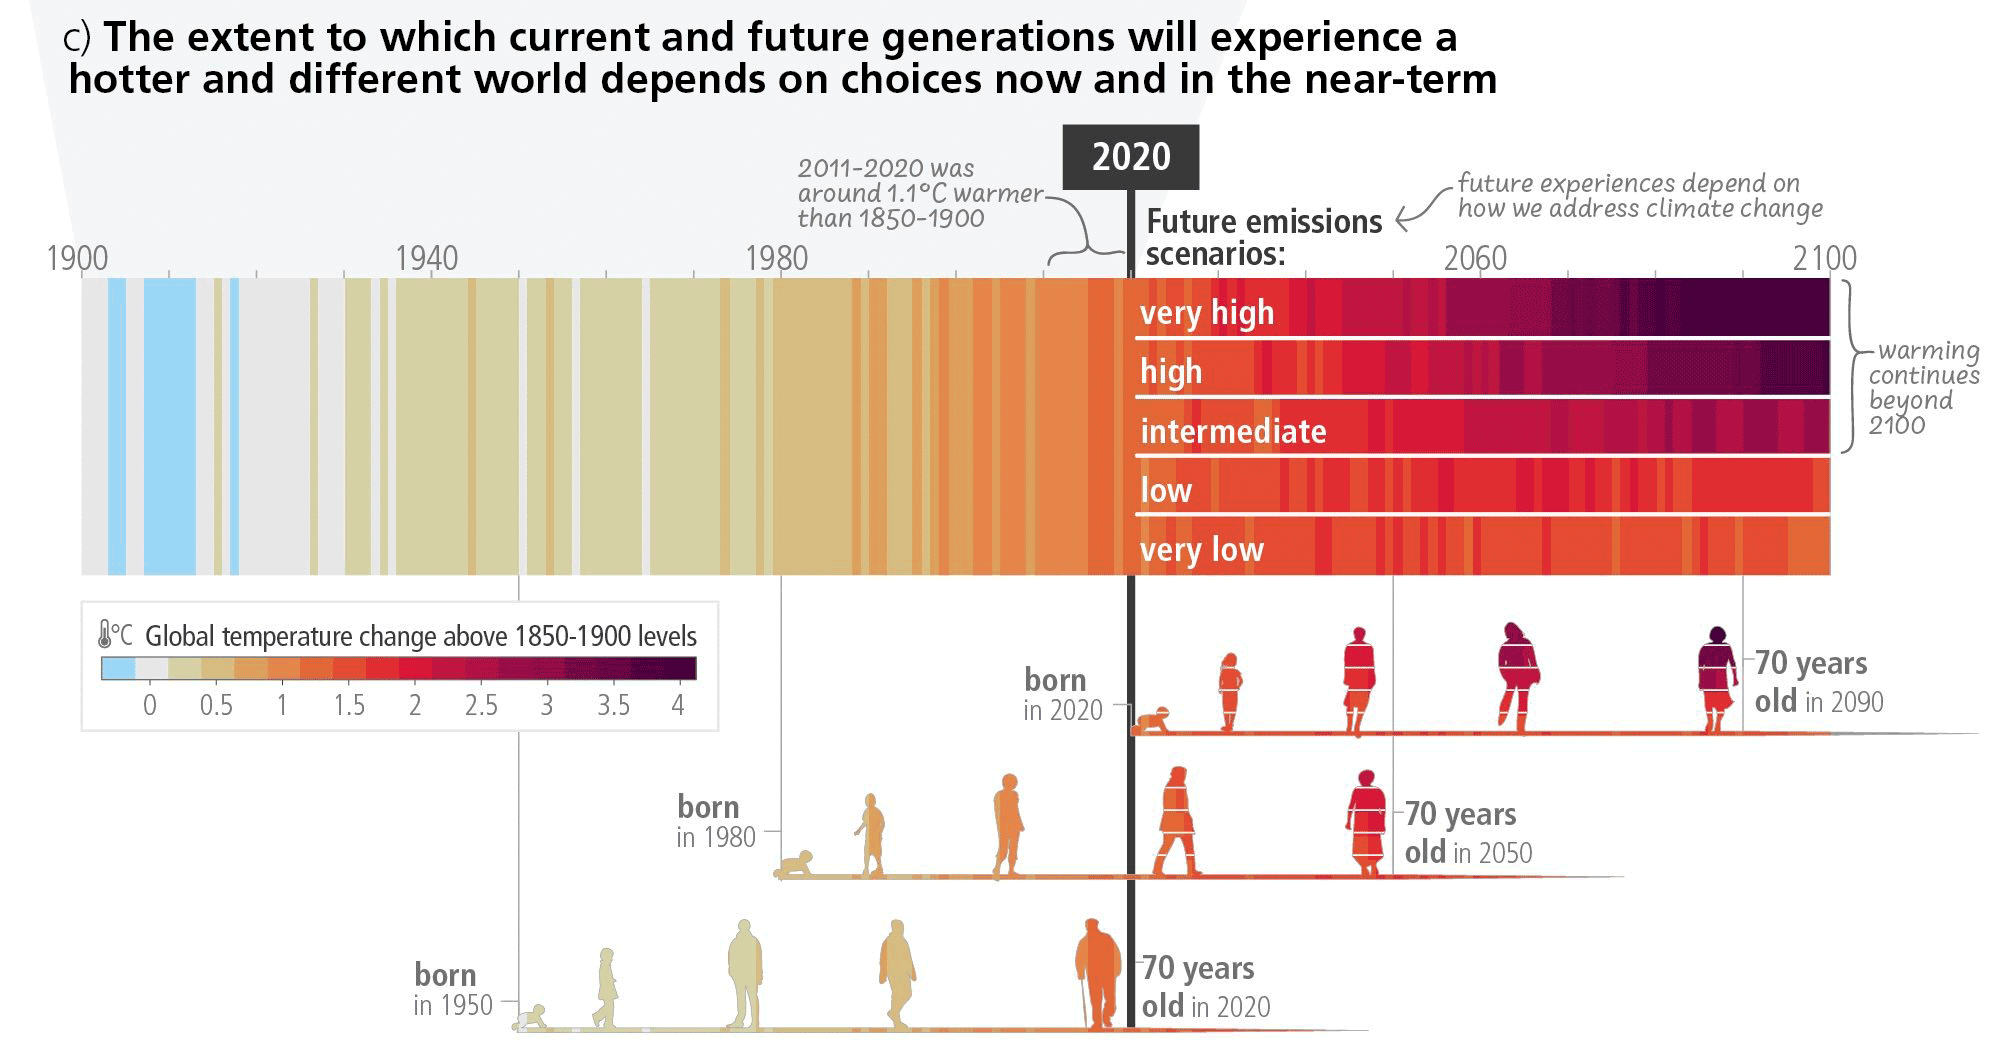
Source: IPCC AR6 Synthesis Report 2023
Limiting warming to 1.5 degrees C and 2 degrees C requires rapid, deep GHG emission reductions.
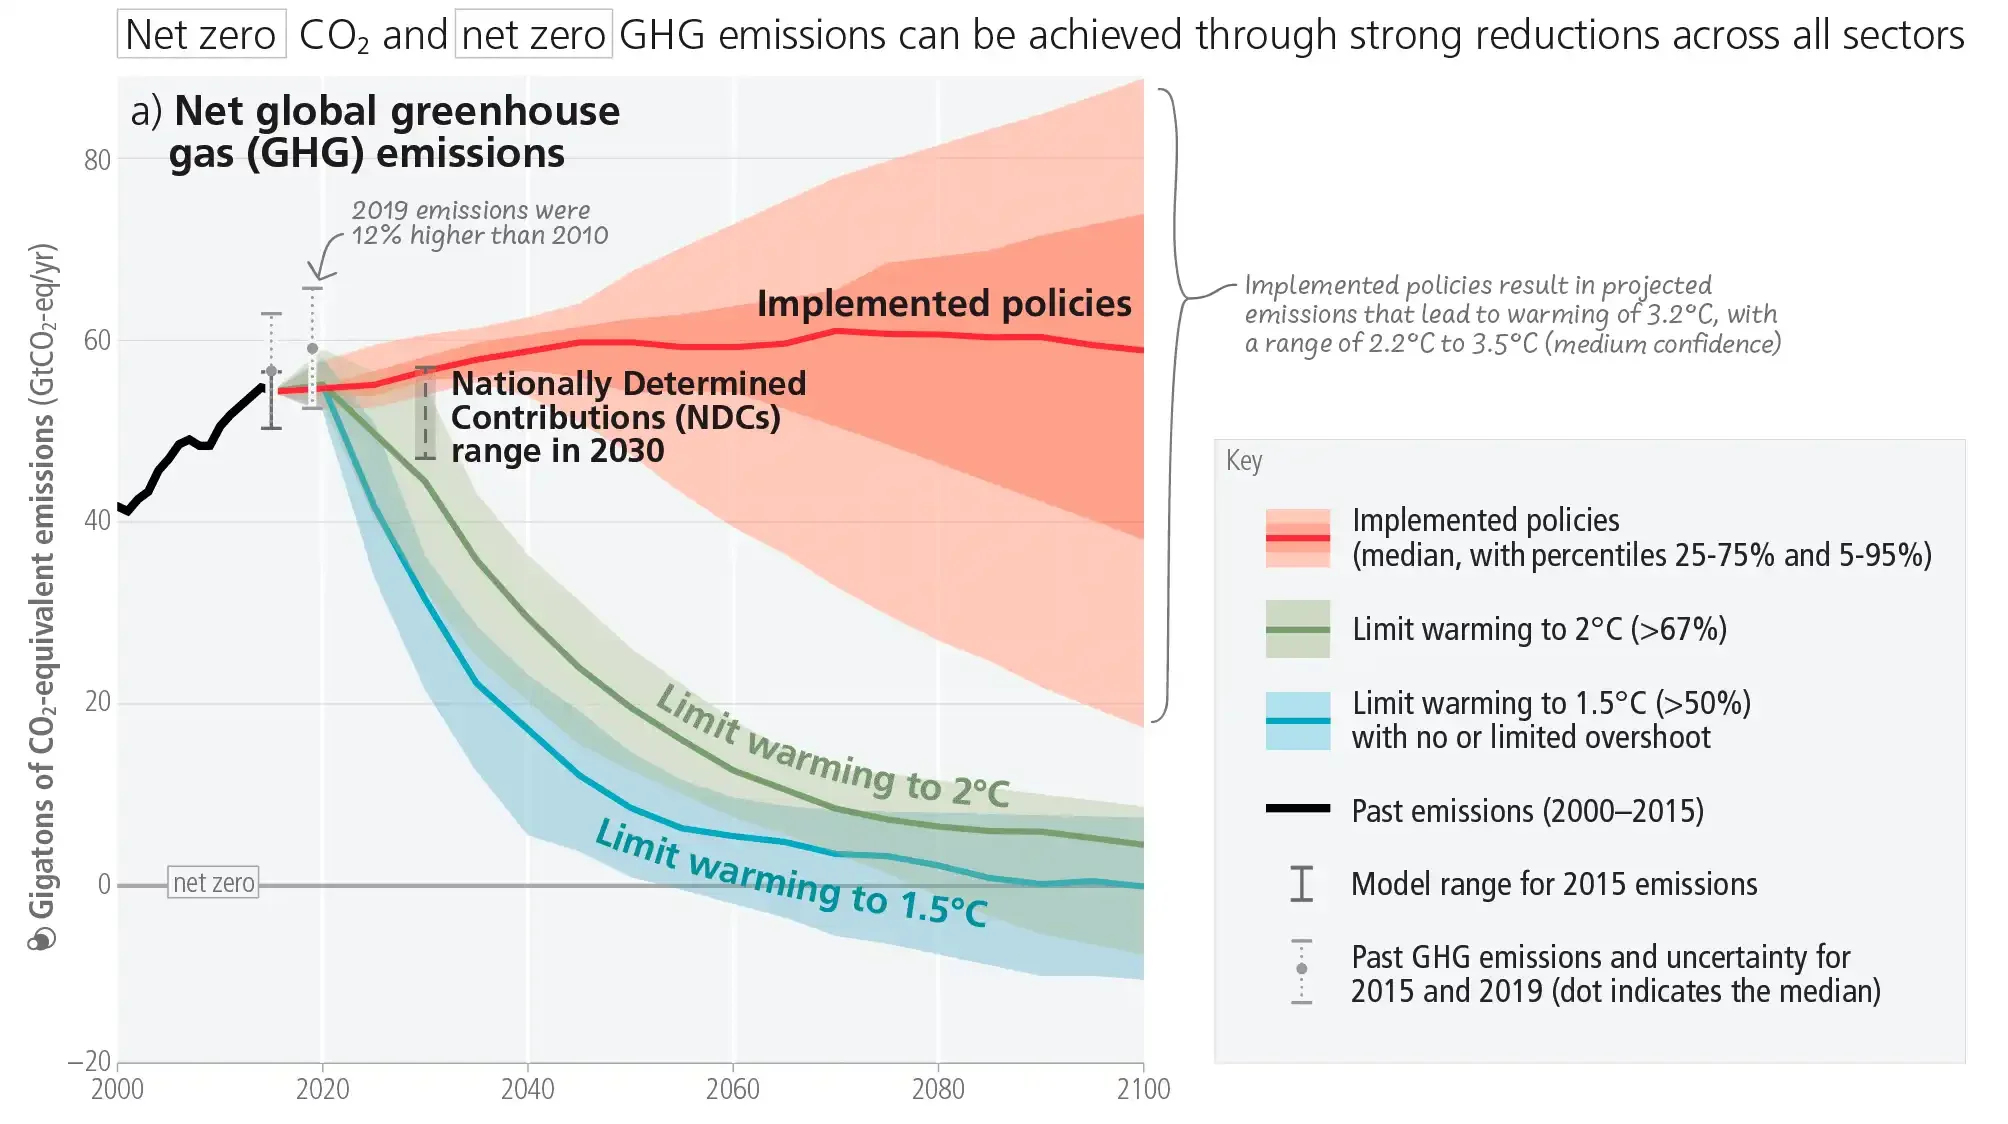
Source: IPCC AR6 Synthesis Report 2023
Your emission reductions are part of a global effort to reduce the threat of dangerous climate change.